Graphs Demonstrating the Gender Wage Gap
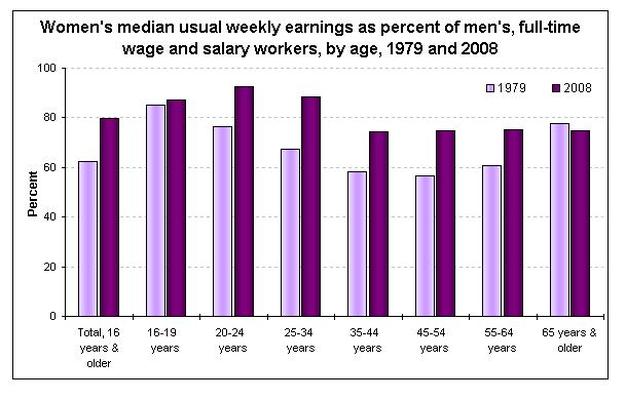
The biggest wage gap occurs between the age of 25-34 and has increased dramatically since the 1970's.
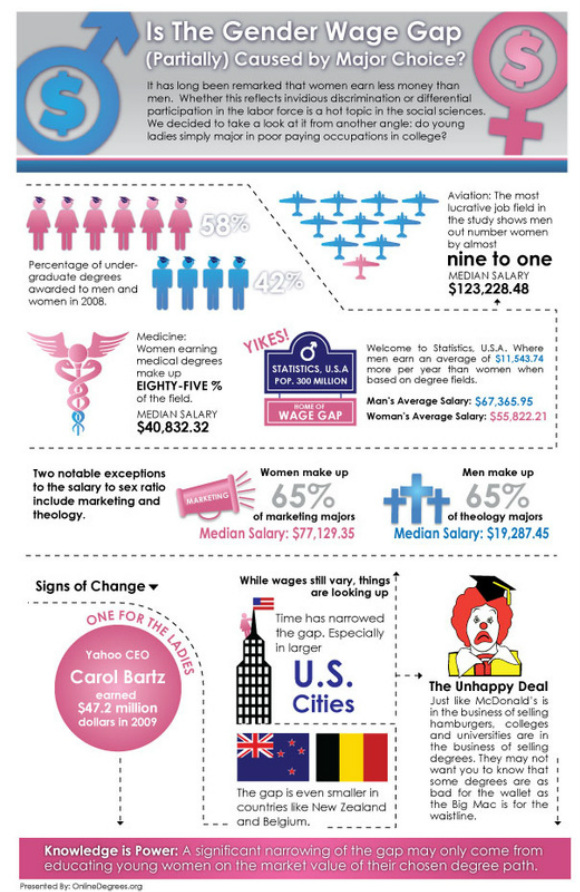
The graphs below represent the disparity between levels of education versus the wage gap and gender.
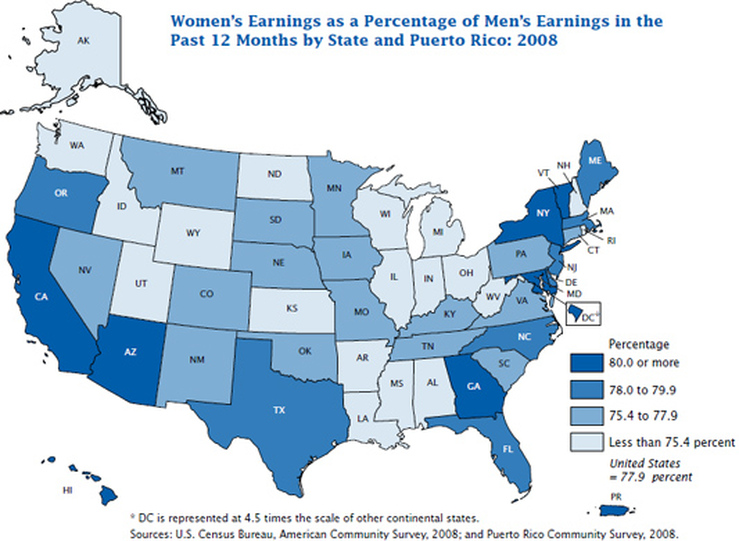
This graph represents the fifty states and how little women earn in comparison to men by percentage.
